SEAS Population Demographic Data
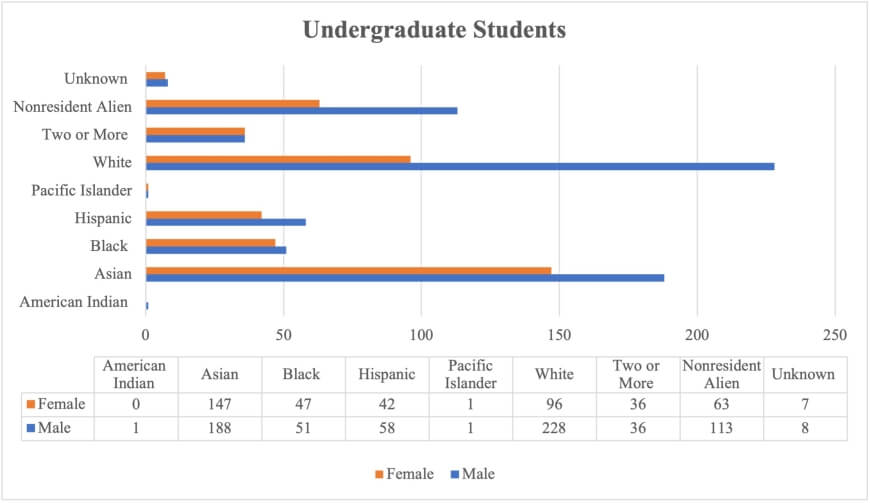
In accordance with the SEAS DIB Strategic Plan, the following demographic data from the SEAS Institutional Research team is being provided as a general source of information on population demographics for the SEAS community. The numbers presented here may differ slightly from other reports produced by SEAS or Harvard University based on when the data was captured. Unless otherwise noted, data is from the 2021-2022 academic year. For further detail, please contact the Institutional Research team with any questions.
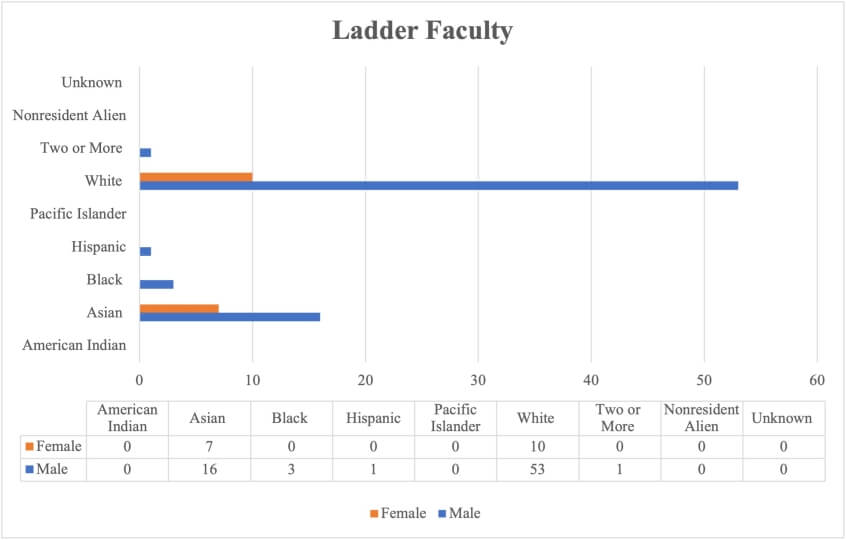
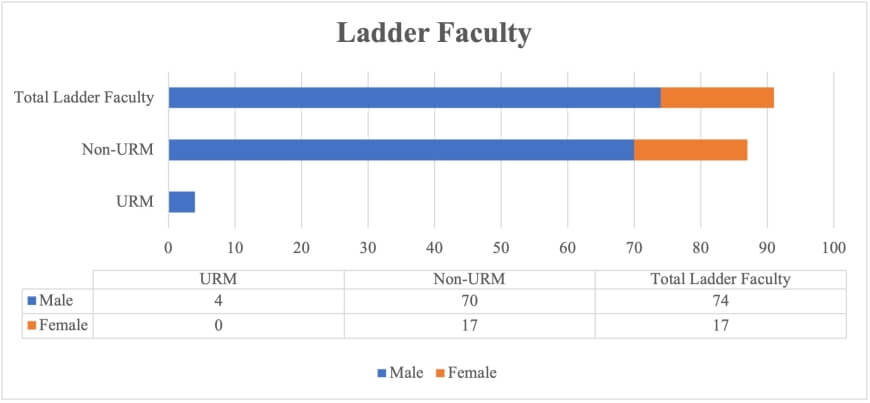
Data does not include non-ladder faculty or post-doctoral fellows and researchers.
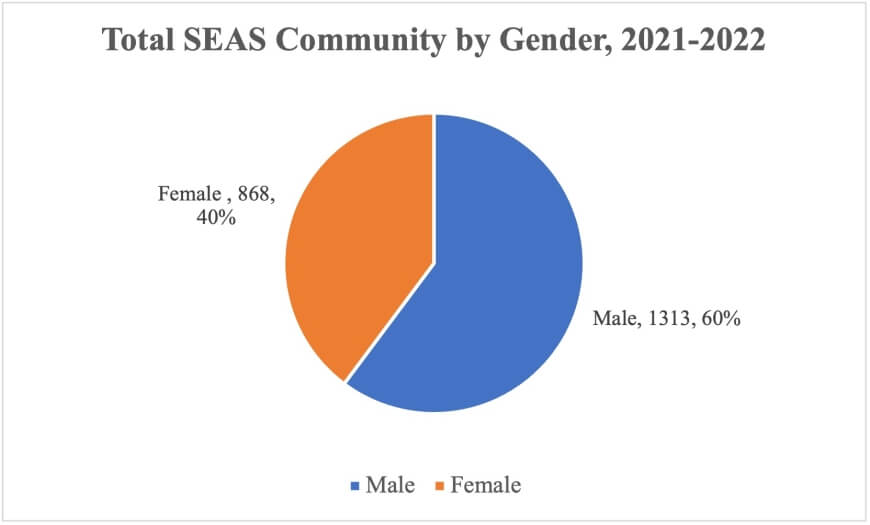
SEAS recognizes that gender is not a binary and is actively working to collect data that accurately reflects all members of our community. Data from SEAS postdoctoral fellows is not included.
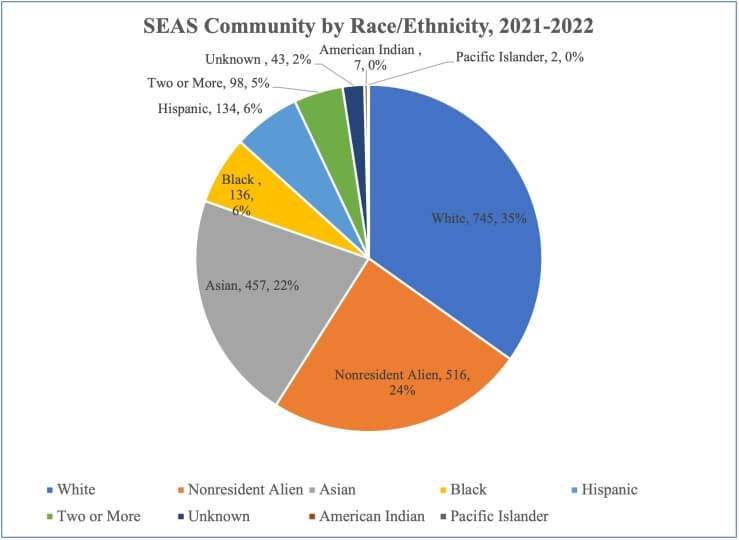
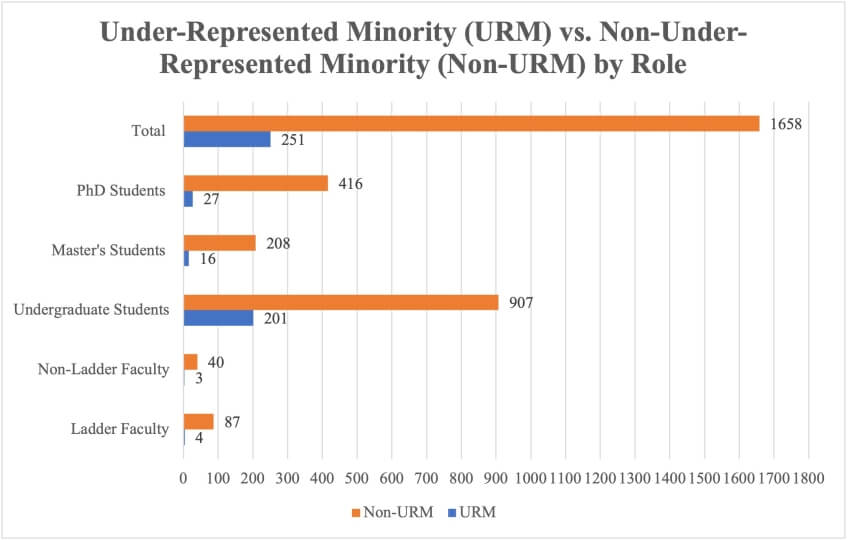
Per data reported to the American Society of Engineering Education, "under-represented minorities" is classified here as those who identify as Black, Hispanic, Native American/Hawaiian/Pacific Islander, and excludes international students and those with 2 or more races. Where gender statistics are reported, SEAS recognizes that gender is not a binary and is actively working to collect data that accurately reflects all members of our community.
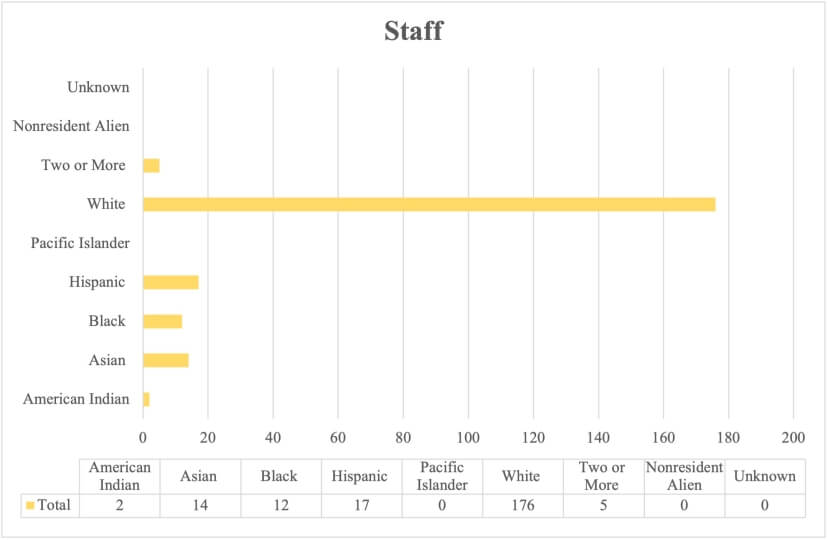
Data for postdoctoral fellows is not included. Data for staff is included elsewhere.
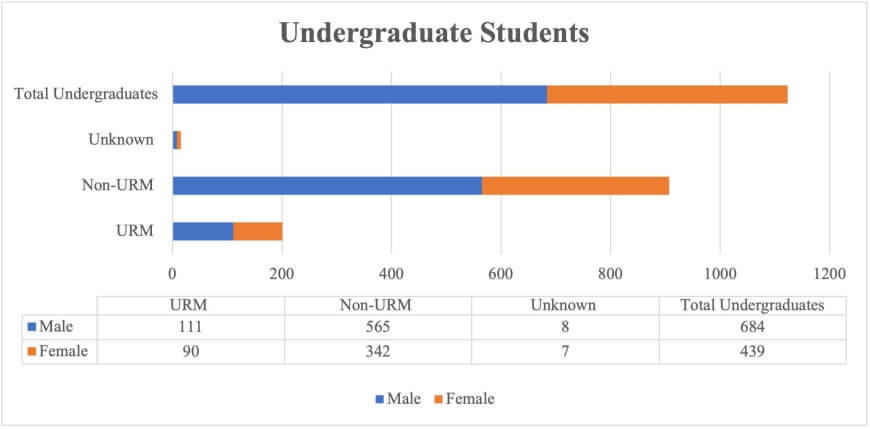
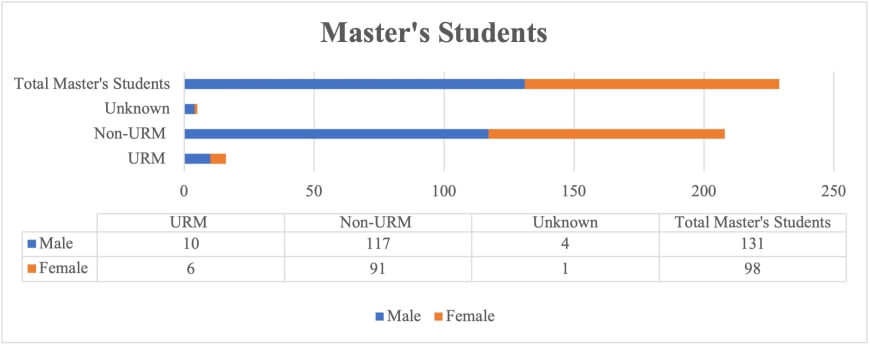
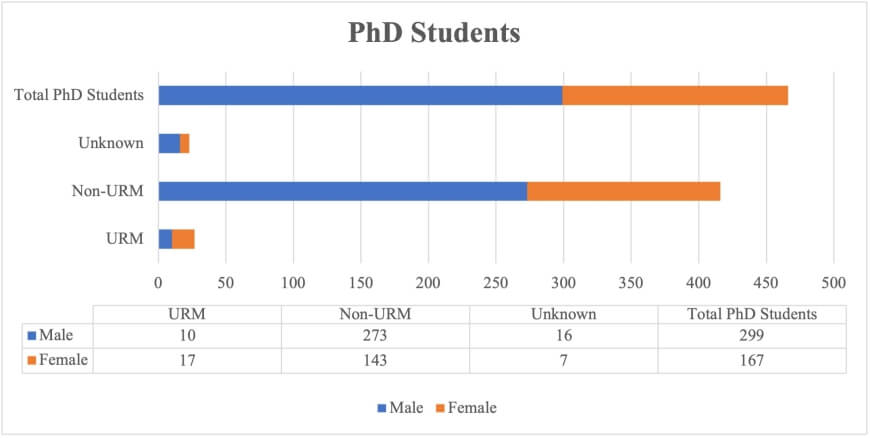
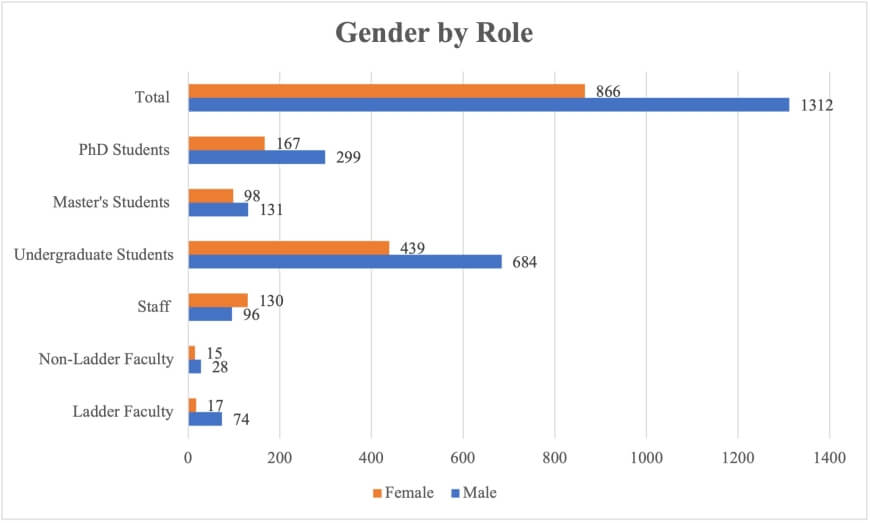
Regarding gender statistics, SEAS recognizes that gender is not a binary and is actively working to collect data that accurately reflects all members of our community.